Computer Controlled Cooling Boxes
Since 2005 the Cryonics Institute (CI) has had two computer-controlled cooling boxes, a large one for human patients and a small one for pets & testing. These cooling boxes are designed to bring the temperature of patients or pets from above water-ice temperature after perfusion to liquid nitrogen temperature for long-term storage. The use of vitrification solution for perfusion mandates rapid cooling before solidification temperature (Tg, near minus 120 degrees Celcius) to prevent ice formation. There should also be slow cooling below solidification temperature to liquid nitrogen temperature to prevent or minimize cracking. Other circumstances or testing may call for other cooling profiles. Our computer-controlled cooling boxes give us the ability to control cooling rates with some precision in any temperature range (with minimal manual supervision), and to log the temperature changes that actually occur so that cooling curves can be generated and studied.
From 2005 to 2009 computer control of the two cooling boxes was by a LabView/National Instruments system that was custom created for CI by Wineman Technology, Inc.
The local (Clinton Township, Michigan) cryogenic engineer Marc McMaken built the small cooling box and provided the controlling hardware for both boxes.
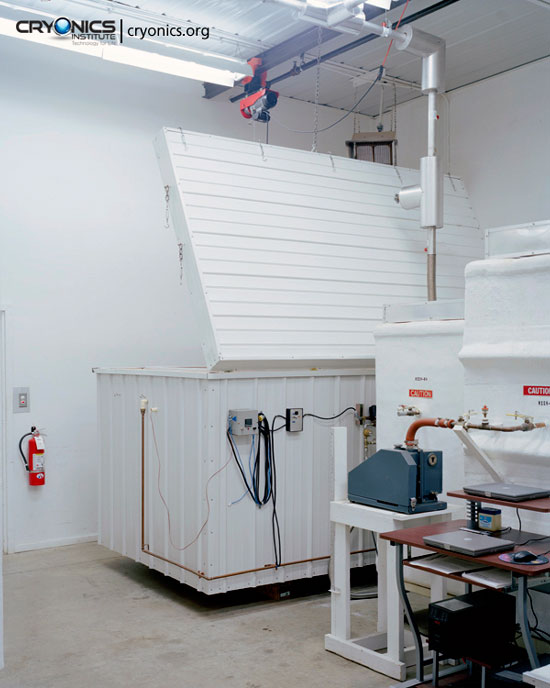
The large cooling box is made of wood and extruded polystyrene foam insulation. The small cooling box is made of stainless steel and a type of foam insulation. Both cooling boxes have a long bar on the inside which is perforated with small holes that can shoot-out liquid nitrogen. Although the liquid nitrogen is quite cold, much of the cooling comes from heat absorbed when the liquid nitrogen vaporizes into gas — ie, the liquid nitrogen vaporization is an endothermic process. The heat of vaporization for liquid nitrogen is 5.57 kiloJoules/mole.
(For an endothermic process the gain in entropy is greater than the loss of enthalpy, which is a way of saying that the molecules prefer the freedom of being in a gas to the constraints of being in a liquid — and will take-up heat for the opportunity to be a gas. Burning firewood or gasoline in a car are exothermic processes because heat is released rather than absorbed.)
Injection of liquid nitrogen into the cooling boxes is controlled by a Magnatrol Type-M normally-closed valve (10M61Z) which is rated for liquid nitrogen. A pressure regulator keeps the injection pressure at 45 PSI (Pounds per Square Inch). A 75 PSI pressure safety valve on the liquid nitrogen tank blows-off whenever pressure reaches 75 PSI in the tank. Too much pressure in the tank would hamper efficient operation of the 45 PSI pressure regulator.
The Magnatrol valve is controlled by an electrical relay switch located in a power/relay box mounted on the cooling boxes, but only when a toggle switch on the power/relay box is in the up position. A +24 volt DC signal from the computer controller allows AC power from a wall socket to open the Magnatrol valve. No voltage (0 volt signal) comes from the computer controller when the Magnatrol valve is to be closed. An orange indicator light on the power/relay box is lit when the AC power is activating the Magnatrol valve.
The signals received from the computer controller are based on temperature readings received from a thermocouple in the cooling box that has been placed in the patient or on the test object. We use T-type thermocouple beaded probes which have an operating range of −200ºC to +350ºC.
On the advice of Marc McMaken I bought an Omega 1/16 DIN CN96111TR-C2 controller. Andy Zawacki, who has had electronic training, wired the controller. The Magnatrol solenoid valve would noisily oscillate with the new controller, making me suspect that the solenoid was defective. Eventually Marc and Andy got to the root of the problem: the National Instruments controller required a DC relay, whereas the Omega controller required an AC relay. We had been putting AC current into a DC relay. Replacing the DC relay with an AC relay stopped the noisy solenoid valve oscillations.
Power consumption is very low for the Omega controller unit, about 45 watts. We obtained an APC Smart-UPS XL1000 Uninterruptible Power Supply (UPS) with an APC battery pack that could provide enough power during a blackout to keep the cooling box going for 16 hours. That would provide plenty of time to discover the problem and get the generator going or (more likely) for the power to return.
The configuration screen on the laptop allows the operator to program a sequence of cooling steps, where each step specifies a target temperature. The rate at which the Magnatrol valve opens and the duration of the valve opening is determined by calculations in the computer based on the specifications in a cooling step and the temperature of the controlling thermocouple. A cooling curve will be displayed on the computer screen, which can be saved for future examination or for printing.
An example of a sequence for cooling a patient from water-ice temperature to liquid nitrogen temperature might be the following:
(1) cool to −130ºC in 8 hours
(2) hold at −130ºC for 4 hours
(3) cool to −196ºC in 200 hours
The computer will calculate a cooling rate (slope of a line on a cooling curve) that is necessary to achieve the desired target temperature (eg, −130ºC) in the desired time (eg, 8 hours) for each step. When the program is started, the computer begins opening the Magnatrol valve at a rate required to achieve the desired cooling rate based on feedback from the controlling thermocouple (which would be the thermocouple in the throat used to approximate brain temperature).
The LabView/NI software/hardware allowed for four thermocouples, but the Omega software/hardware only allows for one thermocouple. I have had enough experience with the LabView/NI software/hardware, however, to understand the relationship between ambient, body and brain temperature during the process of cooling. Cooling is controlled by ambient temperature, which results in the most gentle cooling of the patient, despite the fact that the temperature fluctuations at the thermocouple make it appear to be the least gentle.
With only a single temperature probe and limited graphics capabilities, graphing with the Omega system is less sophisticated than with LabView. The Omega data from the single probe can be exported to a Microsoft EXCEL file. A chart can be created from EXCEL’s charting capabilities.